data.cube - Exploration of Multidimensional Data
Présentation issue d’un ateliers du groupe FMR
data.cube is an R package for the exploration of multidimensional datasets and for the detection of statistical outliers within. It is mainly a tool for data exploration, allowing to have a first glance at it and to formulate research hypotheses to be later tested.
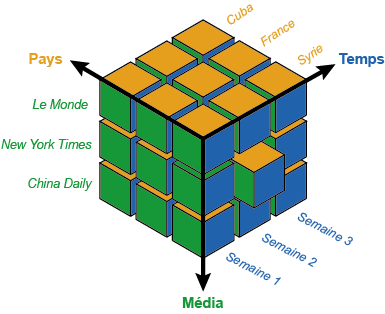
The package defines a new data structure called data.cube that can be fed with a classical data.frame encoding a list of numeric observations described according to several categorical dimensions. For example, in the case of Twitter data, it can be the number of tweets (numeric observation) that have been published by a given user (first dimension) about a given topic (second dimension) at a given date (third dimension). The input data.frame hence takes the form of a list of quadruplets (user, topic, date, number of tweets).
Statistical outliers can then be identified among the observations by first selecting some dimensions of interest, that is by subsetting or by aggregating the input dimensions. If needed, observations can also be normalised according to the marginal values along the selected dimensions, thus comparing the observed value to an expected value obtained by the uniform redistribution of the selected marginal values. Different statistical tests can then be chosen to measure the deviation between the observed and the expected values. The package finally allows to retrieve a list of positive outliers, that is observations that are significantly higher than expected.