dygraph for R
The dygraphs package is an R interface to the dygraphs JavaScript charting library
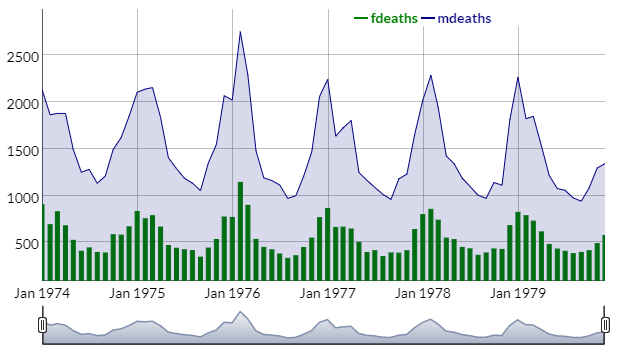
The dygraphs package is an R interface to the dygraphs JavaScript charting library. It provides rich facilities for charting time-series data in R, including:
- Automatically plots xts time series objects (or any object convertible to xts).
- Highly configurable axis and series display (including optional second Y-axis).
- Rich interactive features including zoom/pan and series/point highlighting.
- Display upper/lower bars (e.g. prediction intervals) around series.
- Various graph overlays including shaded regions, event lines, and point annotations.
- Use at the R console just like conventional R plots (via RStudio Viewer).
- Seamless embedding within R Markdown documents and Shiny web applications.