Travel time calculation with R and data visualization with Observable
Application to artifical climbing walls in Paris and its neighbourhood
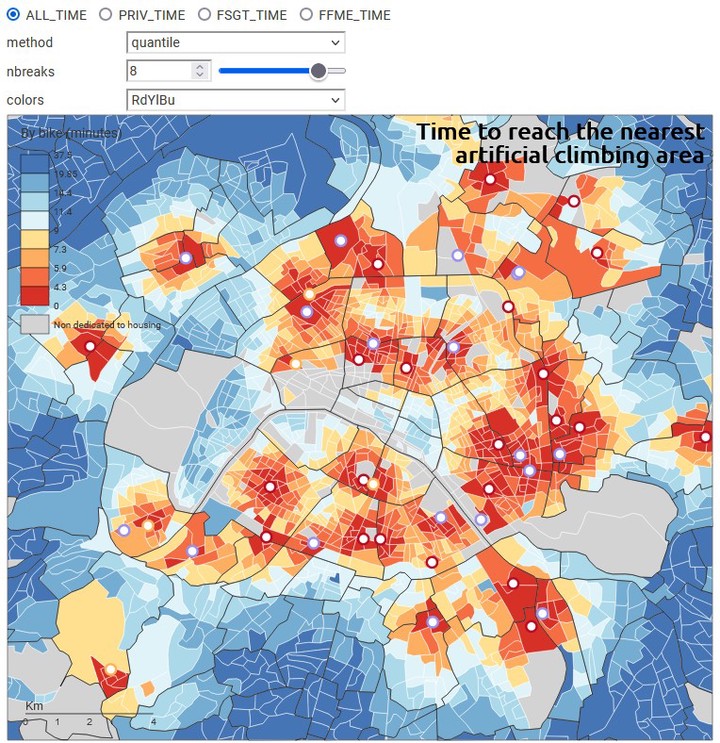
The aim of this notebook consists in showing how to build, visualize and reproduce accessibility indicators by combining points of interest (POI) coming from the OpenStreetMap database, socio-economic indicators included in small territorial division (IRIS) coming from institutional data source (INSEE) and routing engines (OSRM).
The graphical outputs displayed in this notebook are further developed in an Observable collection. To introduce the reader to the issues raised by indoor sport-climbing in Paris, have a look to this notebook.
This Quarto document combines 2 programming languages : R for data processing, and ObservableJS for data visualizations.