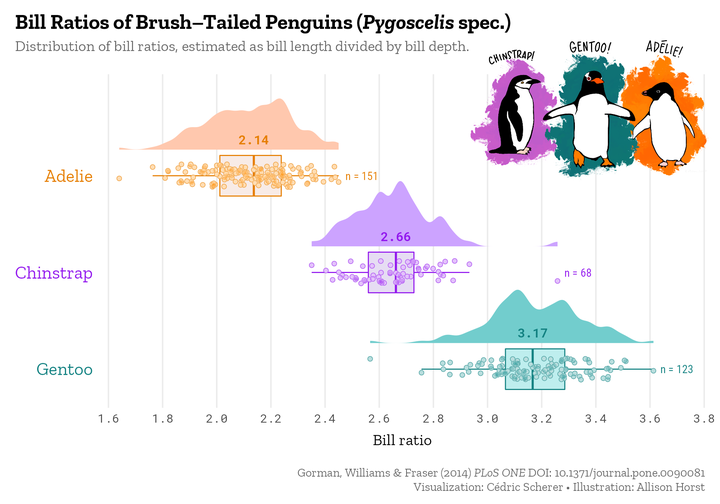
How to plot different version of violin–boxplot combinations and raincloud plots with the {ggplot2} package. Some use functionality from extension packages (that are hosted on CRAN): two of my favorite packages (1, 2) namely {ggforce} and {ggdist}, plus the packages {gghalves} and {ggbeeswarm}.

