Congressional data in R
A comprehensive guide
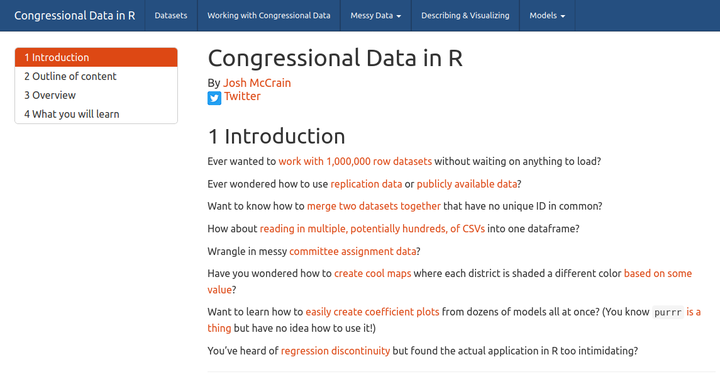
This guide is organized in 6 parts:
- Congressional Datasets – An overview of available datasets covering different aspects of Congress, from off the shelf data to publicly available government data to other niche sources.
- Working with Congressional Data – How to start working with existing data, including merging datasets together by common IDs, wrangling data into proper formats, and creating new measures such as bill introductions. This is a great introduction to working with R’s tidyverse framework in a practical setting.
- Messy Congressional Data – What do you do when you have two datasets that don’t share IDs? This guide goes through first how to clean up these data and prepare them for merging, how to merge, and then how to fix errors. It also shows how to work with publicly available data and replication files and put them into an existing dataset that is ready to use for regressions and visualization.
- Descriptive Statistics and Visualizations – So you finally have your dataset ready to go, now what? Here I cover how to produce practical summary statistics, including tables that can be exported into LaTeX, as well as more complex examples of conditional summary statistics. I also show examples of simple and complex visualizations that are ready to be put into academic papers or blog posts.
- Working with Models – You’re ready to run some regressions. This guide shows the basics behind working with linear models including those with high-dimensional fixed effects using the lfe package. I then show examples of working with model output, extracting certain coefficient values, creating coefficient plots, and plotting predicted results.
- Regression Discontinuity – Getting started with regression discontinuity is a bit intimidating. Here, I show it’s actually quite easy using ggplot2 and the rdrobust package.